Choosing an Air Condition Monitor in 2026 requires more than comparing screen size or app features. The right device should show temperature, humidity, energy use, and operating status clearly. Some models also track particulate matter and carbon dioxide. These readings can reveal a blocked filter, poor airflow, or an oversized cooling cycle.
A dependable monitor uses calibrated sensors and records stable measurements over time. Look for a stated accuracy range, update frequency, and a history log that can be exported. A bright display helps during nighttime checks, while phone alerts can warn about unusual temperature changes. Wi-Fi is useful, but local storage matters when the internet fails. It happens more often than product pages suggest.
Safety and privacy deserve equal attention. Choose products with clear firmware support, secure account controls, and a realistic warranty. Avoid trusting a single reading without checking room position. A monitor placed beside a vent may report misleadingly cold air. Place it near the breathing zone, away from sunlight and appliances. For older air conditioners, confirm compatibility before purchase. Smart controls can improve comfort, but they should not replace professional electrical or refrigerant inspections. Real-world testing should include a hot afternoon, a quiet night, and a filter-change cycle. One weakness remains: affordable sensors may drift after months of use. Recalibration is easy to forget. This guide explains how to compare accuracy, connectivity, privacy, installation, and long-term value before choosing the most suitable Air Condition Monitor for your space.
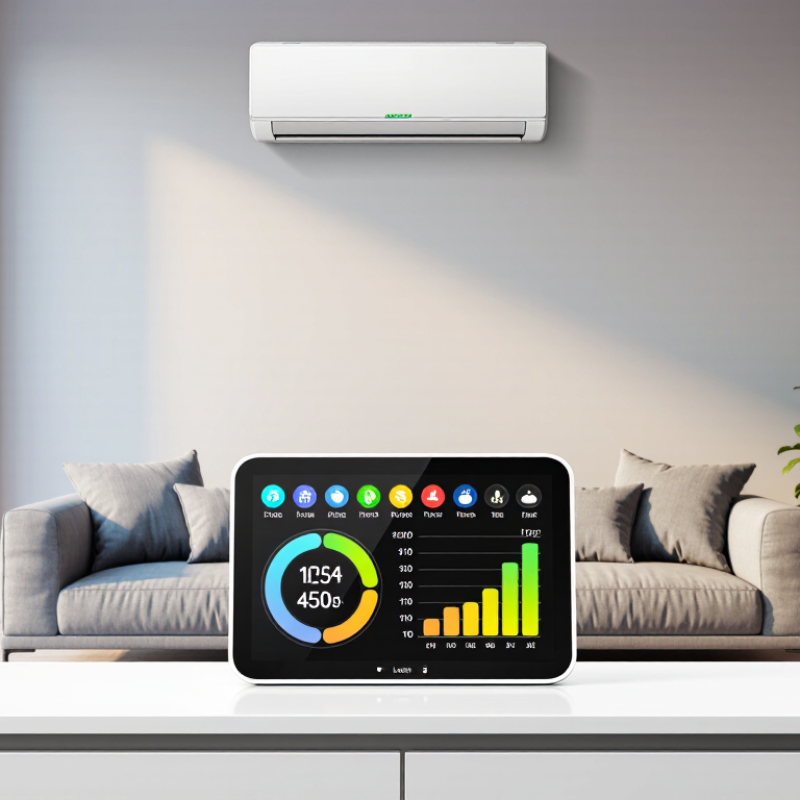
An air-conditioner monitor is useful when its readings answer a real question. For cooling, track room temperature near the occupied area, not beside a vent or sunny window. Compare readings on warm afternoons and after the unit has run for twenty minutes. A single snapshot can mislead.
For energy, choose a monitor that measures circuit-level use or explains its estimate. Runtime alone cannot show actual electricity consumption.
Humidity matters too. A room can feel clammy even when the temperature seems comfortable. Watch for sustained humidity levels instead of reacting to one brief spike. PM2.5 tracking can show changes in fine-particle levels while cooking or airing a room. It cannot identify the particles’ source, and placement affects readings. That is easy to overlook.
Tips: Set one goal first. Place the monitor at breathing height, away from direct airflow. If possible, compare its readings with a trusted thermometer and keep a simple log. Don’t chase every fluctuation. Some data will be noisy, so consider that before changing your cooling habits.
WHO’s annual PM2.5 guideline is 5 µg/m³. Treat it as a health benchmark, not a pass-or-fail rule for one room or one reading. It describes an annual average, so a brief spike from cooking does not tell the whole story. Consistent measurements over time are more useful.
When choosing an air-conditioner monitor, check that it measures PM2.5 and reports units clearly. Look for a stated accuracy range and guidance on calibration; a precise-looking decimal is not proof of precision. Place the device near the area where people spend time, but away from direct supply-air jets, open windows, and cooking fumes. Small details matter. A sensor beside an air outlet may show a cleaner pocket of air than the room’s typical breathing zone.
Compare readings across several days, including periods when the air conditioner is running and off. Note cooking, open windows, and filter changes, since these can shift particle levels. If readings stay above the benchmark, inspect the filter and airflow, and consider whether outdoor pollution is entering the room. One imperfect reading is easy to overinterpret; even good monitors have limits. Use trends as a practical signal, not a diagnosis, and seek professional advice if persistent poor air quality is a concern.
Set an air-quality benchmark: compare annual PM2.5 readings with recognized health guidance and standards.
The WHO’s 2021 air-quality guideline recommends an annual PM2.5 level of no more than 5 µg/m³. The US EPA’s annual PM2.5 standard is 9 µg/m³, finalized in 2024. When comparing monitors, check that they measure PM2.5 and can report averages over time; these benchmarks are not indoor limits or live readings.
Sources: WHO Global Air Quality Guidelines (2021); US EPA National Ambient Air Quality Standards for Particulate Matter (2024).
How to Choose an Air Conditioner Monitor in 2026?
An air conditioner monitor is useful only when its readings reflect the room people occupy. Compare stated accuracy, measurement range, and calibration details—not just the number of decimal places on its display. A temperature reading of 24.0°C looks precise, but the sensor may still have meaningful uncertainty. Check the full specification sheet for accuracy across the operating range, not only at one reference point. Small print matters.
ASHRAE 55 addresses thermal comfort, including air temperature, radiant temperature, humidity, air speed, clothing, and activity. It is not a simple pass-or-fail label for a monitor. A basic device that measures temperature and humidity can help track conditions, but it cannot describe every factor in the standard. For example, a sensor beside a cold supply vent may report a comfortable room average poorly. Placement changes the story.
Look for a range that covers realistic room conditions, including humid summer afternoons and cooler nights. Then check how the device was calibrated, whether calibration is traceable, and whether it can be checked again over time. A practical comparison uses a stable reference thermometer and lets both sensors settle in the same shaded spot. Avoid direct sunlight. If readings drift, investigate before adjusting the AC. This step is easy to skip, and I would not treat one quick comparison as proof of accuracy.
Compare the monitor’s stated measurement range and accuracy with the conditions you need to assess. The targets below are practical selection guidance, not a claim that every value is prescribed by ASHRAE 55. Check the applicable edition of the standard and the instrument’s calibration documentation for formal assessments.
| Measurement | Useful monitor range | Practical accuracy target | Relevance to ASHRAE 55 | Calibration and check guidance |
|---|---|---|---|---|
| Air temperature | 10–40 °C (50–104 °F) covers common occupied indoor conditions. | About ±0.2 °C (±0.4 °F) near room temperature is a useful target for comfort assessments. | A key input for thermal-comfort evaluation; placement and measurement procedure also matter. | Check against a traceable reference thermometer on the manufacturer’s schedule and after damage or suspected drift. |
| Relative humidity | 20–80% RH is useful for typical indoor monitoring; a wider 0–100% RH rating may improve flexibility. | ±3 percentage points RH is a strong practical target; compare actual specifications across the operating range. | Humidity can affect comfort calculations, but it does not alone determine whether conditions meet the standard. | Use a documented humidity reference or calibration service; follow the sensor maker’s recommended interval. |
| Air speed | 0.05–2 m/s is a useful range for occupied spaces and airflow near air-conditioning outlets. | Look for a low-speed specification around ±0.05 m/s, with stated accuracy across the full range. | Important because air movement affects thermal sensation; low-speed performance is especially relevant indoors. | Check in a suitable calibrated airflow facility. Confirm the sensor is appropriate for low velocities and the intended measurement method. |
| Mean radiant temperature / globe temperature | Approximately 10–40 °C for common indoor use; verify the instrument’s specified range. | Around ±1 °C is a practical target for a globe-temperature measurement; the calculated radiant temperature also depends on method and airflow. | Radiant conditions can affect comfort. A simple room-temperature sensor cannot measure this quantity by itself. | Check the temperature sensor and globe assembly; allow adequate stabilization and follow the instrument’s measurement procedure. |
| CO₂ (optional) | 400–2,000 ppm suits many occupied-space checks; up to 5,000 ppm provides additional headroom. | For an NDIR sensor, compare the full specification; a common specification format is ±(50 ppm + 3% of reading). | Useful for ventilation context, but CO₂ is not a direct thermal-comfort measurement or a substitute for ASHRAE 55 evaluation. | Check whether automatic baseline correction suits the space; verify with a known reference or service calibration when accuracy is important. |
| Logging and calibration records | Choose a sampling interval and storage capacity that cover the intended observation period. | Check resolution, stated accuracy, response time, and whether accuracy is specified over the full range—not just at one point. | Reliable, time-stamped records support repeatable assessment but do not replace the standard’s required procedures. | Prefer traceable calibration certificates, documented as-found/as-left results, and a clear recalibration interval based on use and drift history. |
Selection note: Confirm whether the device measures each quantity directly or estimates it, and review sensor placement, response time, operating limits, calibration traceability, and the current applicable ASHRAE 55 requirements before using readings for a formal compliance assessment.
An air conditioner monitor should do more than display temperature. Its humidity alerts can help you notice when a room drifts outside the EPA’s recommended indoor range of 30–50%. That range is a useful guide, not a promise of perfect comfort. A bedroom reading of 52% after a rainy afternoon may call for attention, while one brief fluctuation may not.
Look for adjustable alerts and a clear humidity history. A simple graph can show whether moisture rises during cooking, after showers, or when the AC cycles off. Place the sensor away from supply vents, sunny windows, and damp corners. Small details matter. Air blowing directly over a sensor can distort its reading, and inexpensive devices may differ slightly. Compare readings with a second meter if the numbers seem implausible; even then, neither device is automatically correct.
Choose a monitor that makes trends easy to understand, rather than one that sends constant warnings. If indoor humidity stays above 50%, check for everyday sources of moisture and whether the cooling system is running effectively. If it remains unusually low, dry air may also feel uncomfortable. Alerts are clues, not diagnoses. A monitor can’t explain every cause, and I’d be cautious about treating one odd reading as a firm conclusion.
How to Choose an Air Conditioner Monitor in 2026?
Verify Energy Tracking Against DOE’s 6% U.S. Electricity Cooling Share
The U.S. Department of Energy commonly cites air conditioning as roughly 6% of national electricity use. Treat this as context, not a target for your home: weather, building size, insulation, and thermostat settings all affect consumption. A useful monitor should show your air conditioner’s actual energy use in kilowatt-hours, not just estimate costs from operating time. Check whether it measures the dedicated HVAC circuit, and whether its readings can be compared with your electricity bill or utility data. Small differences are normal; unexplained, persistent gaps deserve a closer look.
Tips: Review daily and monthly kWh, then compare similar hot-weather periods. Keep thermostat settings and schedules in mind. A dramatic increase may reflect a heat wave, not a failing unit. Monitoring alone cannot diagnose equipment problems.
Look for clear historical charts, exportable readings, and measurement details such as stated accuracy. If possible, compare a monitor’s readings with utility interval data over several days. I still find cost estimates less dependable than raw kWh, since electricity rates and fees can change. That is a useful limitation to remember. Choose a monitor that makes the data easy to verify, rather than one promising savings it cannot prove.
Put it at breathing height in the occupied area, away from vents, sunny windows, and damp corners. Compare it with a trusted thermometer if readings seem unusual.
Record the temperature on a warm afternoon, then check again after the unit runs for about twenty minutes. One reading isn't enough. Vent placement can skew results.
A range of 30–50% is a useful indoor guide. A brief rise to 52% after rain may not need action. Watch for lasting trends.
Prefer measured electricity use in kilowatt-hours, ideally from the dedicated cooling circuit. Runtime alone cannot show actual consumption. Cost estimates may be less dependable.
They can reveal sustained moisture changes, but not identify the cause. Check patterns after cooking, showers, or when cooling cycles stop. Alerts are clues, not diagnoses.
No. It can show fine-particle changes during cooking or airing, but cannot tell where particles came from. Placement affects readings.
Compare several days of kilowatt-hour data with utility readings or your bill. Small differences are normal. Persistent gaps deserve a closer look.
No. Some data is noisy, and a heat wave can raise usage without indicating a problem. Keep a simple log; even that may not explain everything.
Choosing an Air Condition Monitor in 2026 starts with deciding what you need to track: cooling performance, electricity use, indoor humidity, PM2.5, or a combination. Compare each device’s sensor accuracy and measurement range with your room conditions and intended use. Check how often sensors need calibration and whether the monitor clearly reports changes over time, rather than relying only on a single reading.
Use practical benchmarks to judge its measurements: the annual PM2.5 guideline is 5 µg/m³; thermal comfort assessments can be compared with ASHRAE 55; and a recommended indoor humidity range is 30–50%. For energy tracking, consider that cooling accounts for about 6% of U.S. electricity use, making reliable consumption data useful for spotting trends and adjusting habits. A suitable monitor should present these readings clearly, provide helpful alerts, and make it easier to balance comfort, air quality, and energy use.

YCLH Sensor