Environmental Sensors help teams understand conditions that are otherwise easy to miss: fine dust near a busy road, a sudden rise in greenhouse humidity, or changing water quality beside a treatment site. For global buyers, choosing a device involves more than comparing prices. Measurement range, accuracy, response time, power use, and data access all affect whether readings are useful in daily operations.
This guide introduces ten options across applications such as air, water, soil, and weather monitoring. The comparison focuses on practical specifications, documented performance, installation needs, and support for common data systems. Buyers should check manufacturer datasheets and calibration guidance rather than relying on a product label alone. Details matter.
A sensor designed for a controlled laboratory may behave differently outdoors, where heat, dust, condensation, or vibration can influence readings. That trade-off matters. Regional availability, wireless compatibility, and local technical support can also shape the total cost of ownership. No shortlist is perfect; products change, and published specifications do not replace field testing. Use the selections as a starting point, then compare them with your site conditions, reporting needs, and maintenance capacity. A careful fit is often more valuable than the longest feature list.
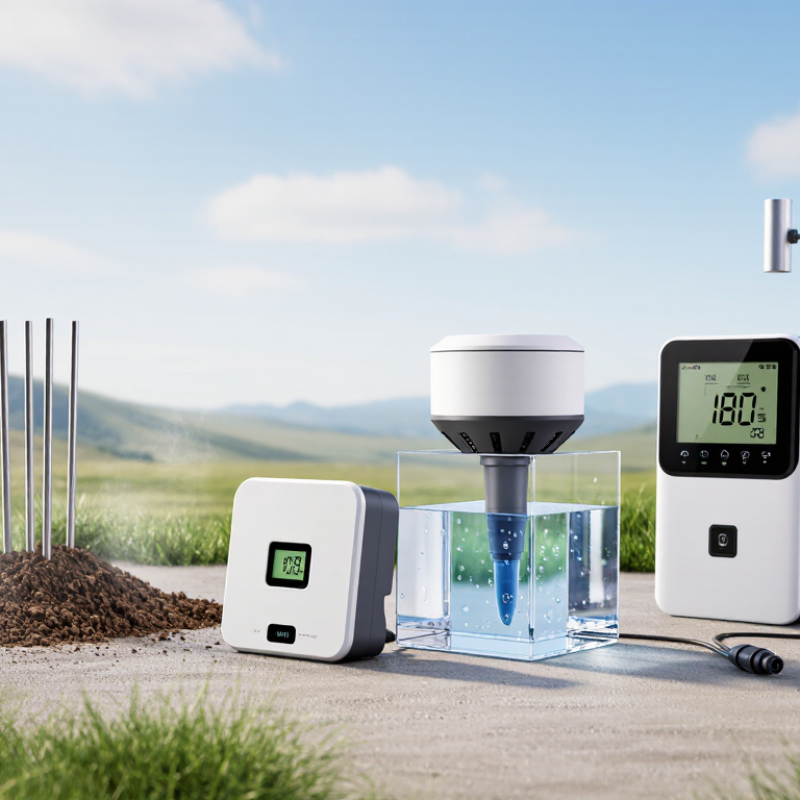
Environmental sensors turn conditions we cannot reliably judge by sight into measurable signals. A temperature probe tracks heat through changing electrical resistance; a humidity sensor detects moisture in air through shifts in capacitance. Optical particle sensors shine light through a small chamber and estimate airborne particle levels from scattered light. Gas sensors use chemical reactions or absorption to detect particular compounds. Different principles suit different environments.
Their readings need context. The World Meteorological Organization’s Greenhouse Gas Bulletin No. 20 reported a 2023 global average carbon dioxide concentration of 420.0 parts per million. That figure describes the global atmosphere, not a single room or roadside. A local sensor may vary with traffic, ventilation, weather, and its position near a wall or exhaust outlet. Small changes matter. But placement matters too.
Many systems log readings over time, revealing patterns that a spot check can miss. A humidity spike after a window opens, for example, may explain a short-lived change in other measurements. Calibration, clean inlets, and comparison with trusted reference instruments help keep results useful. No sensor is perfect. I would question a lone reading, especially when dust, condensation, or poor airflow could distort it. Environmental data become more dependable when measurements, operating conditions, and limitations are recorded together.
| No. | Sensor Type | What It Measures | How It Works | Typical Measurement Range | Common Applications | Key Consideration |
|---|---|---|---|---|---|---|
| 1 | Temperature sensor | Air, surface, or equipment temperature | A thermistor changes resistance with temperature; an RTD uses the predictable resistance change of a metal element. | Common instrument ranges include approximately −40 to 85 °C for many monitoring applications. | Weather stations, cold-chain monitoring, buildings, and industrial equipment | Check the specified accuracy, response time, and probe suitability for the measurement surface or environment. |
| 2 | Relative humidity sensor | Relative humidity in air | A capacitive sensing element changes capacitance as water vapor is absorbed by its moisture-sensitive layer. | Usually 0–100% RH; many general-purpose devices specify accuracy around ±2–5% RH under stated conditions. | Indoor air monitoring, agriculture, storage, and HVAC systems | Condensation, dust, and long-term exposure to high humidity can affect readings or sensor life. |
| 3 | Barometric pressure sensor | Atmospheric pressure | A MEMS pressure element flexes slightly under air pressure; electronics convert the deformation into a pressure reading. | Many weather and altitude devices cover approximately 300–1,100 hPa. | Weather monitoring, altitude estimation, and ventilation systems | Temperature compensation and local calibration are important when comparing small pressure changes. |
| 4 | Carbon dioxide sensor | CO₂ concentration in air | Non-dispersive infrared (NDIR) sensors measure how much infrared light is absorbed at a wavelength associated with CO₂. | Common indoor-air models measure 0–5,000 ppm; other ranges are available. | Classrooms, offices, greenhouses, and ventilation control | Confirm the measurement range and accuracy specification; some units use automatic baseline correction that may not suit continuously occupied spaces. |
| 5 | Particulate matter sensor | Airborne particle concentrations, often reported as PM₁, PM₂.₅, and PM₁₀ | An optical sensor shines light through sampled air and estimates particle levels from scattered light. | Many compact devices report approximately 0–1,000 µg/m³, depending on model and particle fraction. | Indoor air quality, urban monitoring, and dust observation | Optical readings are estimates and can be affected by particle composition, humidity, and calibration assumptions. |
| 6 | Volatile organic compound sensor | Changes in levels of certain volatile organic compounds (VOCs) | A metal-oxide semiconductor element changes electrical resistance when exposed to gases that interact with its heated sensing surface. | Often reported as a relative index or an estimated concentration; ranges depend strongly on the device and calibration. | Indoor air quality, ventilation studies, and process monitoring | Many low-cost sensors respond to multiple gases and cannot identify a specific VOC on their own. |
| 7 | Light sensor | Illuminance, commonly expressed in lux | A photodiode converts incoming light into an electrical signal; filters and processing approximate the response of human vision. | Ranges vary from low-light measurements to tens of thousands of lux or more. | Daylight monitoring, lighting control, and plant-growth studies | Choose a device with suitable spectral response and range for the light source and application. |
| 8 | Sound level sensor | Environmental sound pressure level, often expressed in dB or dBA | A microphone converts sound pressure into an electrical signal; weighting and time averaging produce sound-level readings. | Measurement ranges commonly span roughly 30–130 dBA, depending on the instrument. | Environmental noise surveys, workplaces, and transport studies | Regulatory measurements may require a calibrated sound level meter, an appropriate microphone, and defined measurement procedures. |
| 9 | Wind speed sensor | Wind speed and, with a direction sensor, wind direction | Cup or propeller devices infer speed from rotation; ultrasonic devices calculate wind from the travel-time difference of sound pulses. | Many weather instruments cover speeds from near 0 to approximately 60 m/s, with model-specific limits. | Weather stations, renewable energy, and site monitoring | Mounting position and exposure matter; nearby buildings or trees can distort airflow. |
| 10 | Water pH sensor | Acidity or alkalinity of water | A glass electrode develops a voltage related to hydrogen-ion activity; a reference electrode provides the comparison needed to calculate pH. | The standard pH scale is 0–14; practical probe performance depends on the water and instrument. | Water quality, aquaculture, agriculture, and treatment processes | Regular calibration with buffer solutions and proper probe storage are necessary for dependable results. |
Compare measurement range, resolution, response time, uncertainty, and calibration method. Check units and averaging periods too.
A sensor that works in a dry room may struggle near a humid greenhouse or dusty road. Small differences matter.
Ask for calibration records, test conditions, and uncertainty figures. Compare them with your site’s climate and maintenance capacity.
Review independent test reports and run side-by-side field trials. Compare readings with a trusted reference when possible.
Temperature sensors track heat, while humidity sensors reveal dampness. Soil probes show drying ground; water sensors measure indicators such as pH and dissolved oxygen.
Not always. They may drift or respond to other gases, so placement and calibration matter.
Replacement-part access, power needs, and network coverage can affect costs. These details are easy to overlook.
No. A short spike may go unnoticed, and a tidy display can feel reassuring without proving much. We may still miss something.
Environmental Sensors help organizations monitor the conditions that affect people, equipment, buildings, and natural environments. They detect variables such as temperature, humidity, air pollutants, light, noise, pressure, soil moisture, water quality, and radiation, converting physical or chemical changes into data that can be interpreted and acted upon. Comparing options for global use means looking beyond measurement range to accuracy, response time, durability, power needs, data interfaces, and the ability to operate reliably in different climates and settings.
Choosing suitable sensors also depends on local environmental conditions, applicable technical standards, and connectivity requirements, including whether readings must be available remotely or in real time. Proper installation helps prevent misleading measurements, while calibration checks keep readings consistent over time. Regular inspection, cleaning, and maintenance can extend service life and improve data quality. By evaluating these practical factors together, buyers can select sensor types that fit their monitoring goals and support dependable decisions across diverse applications.

 YCLH Sensor